Get a callback from our team within 20 minutes during business hours.

A Power BI dashboard is a single page that tells a visual story of your data. Dashboards are an interactive way to measure and monitor important metrics in your business. A secure, cloud-based platform allows you to create and view your data through these visual dashboards at the touch of just a button.
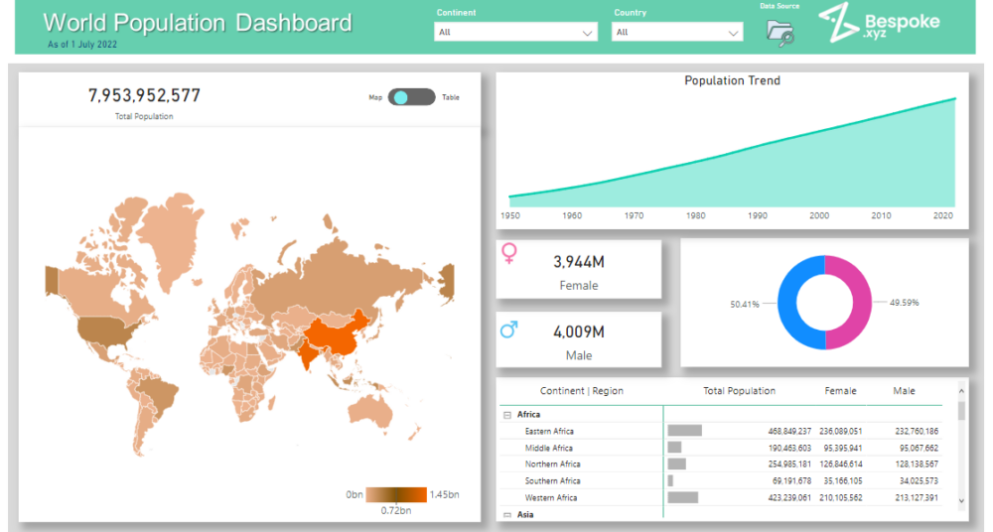
Speak to a Power BI Dashboard Expert to discover how you can transform data into actionable insights, make informed decisions, and drive business success.

"*" indicates required fields
Every business has data. But turning that data into something useful? That’s where we come in.
Our team designs and builds bespoke Power BI dashboards that are shaped around the way you work. Whether you’re tracking performance, forecasting revenue, or managing operations, we make sure the data you need is always at your fingertips – and easy to understand.
We don’t believe in one-size-fits-all templates. Every dashboard is developed in close collaboration with your team to reflect your priorities, your metrics, and your goals. Fully integrated. Fully scalable. And built to help you make smarter decisions, faster.
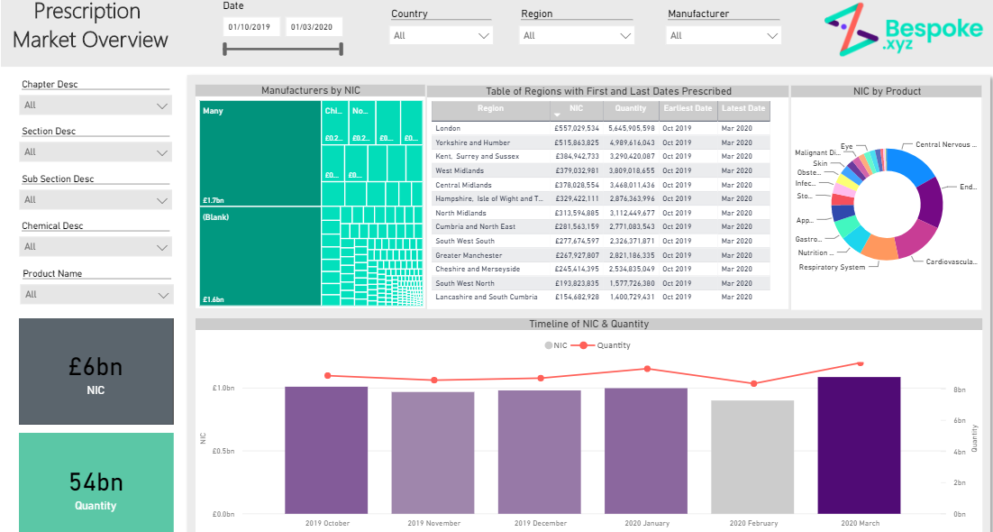

Most businesses already hold more data than they use. A dashboard puts it in one place, in a form your team can actually read and act on.
Building a dashboard is easy and can be done in 4 simple steps. It is a simple and effective way to bring data together to gain insight into key areas of your business and where developments can be made.

A Power BI dashboard can work anywhere you’re making decisions from data. It often lands department by department, pulling scattered numbers into one clear view. A few of the most common:

Track starters, movers and leavers, headcount and retention in one place, so people teams can spot trends instead of rebuilding reports every month.

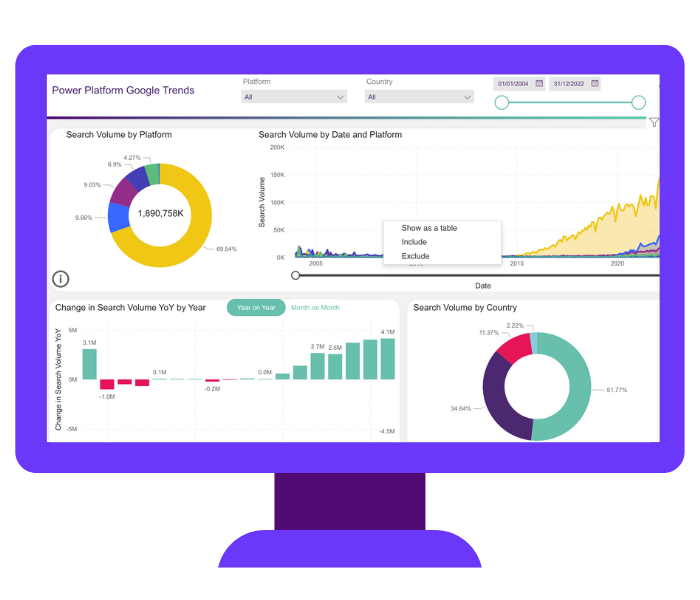
Pull data from third-party sources such as Google Ads and Google Analytics to see who’s visiting your website, where they come from and how campaigns are performing, all alongside your own numbers.
Map every site in your remit on a single view, with a RAG status showing which sites have had their latest check, when they were last visited and whether any actions are still outstanding.
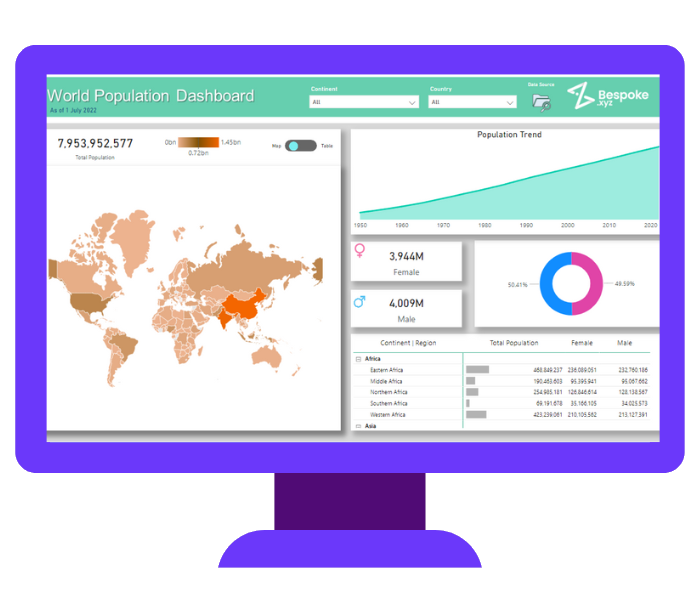
Bring orders, revenue and margin together into a single commercial picture. This is the kind of dashboard that becomes a board reporting pack, giving leadership the full position at a glance.
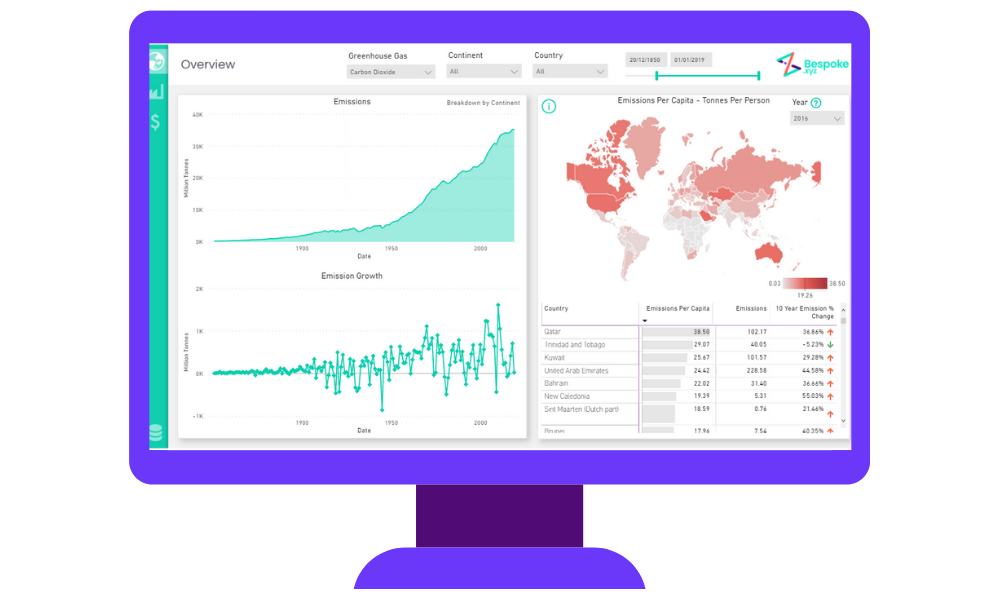
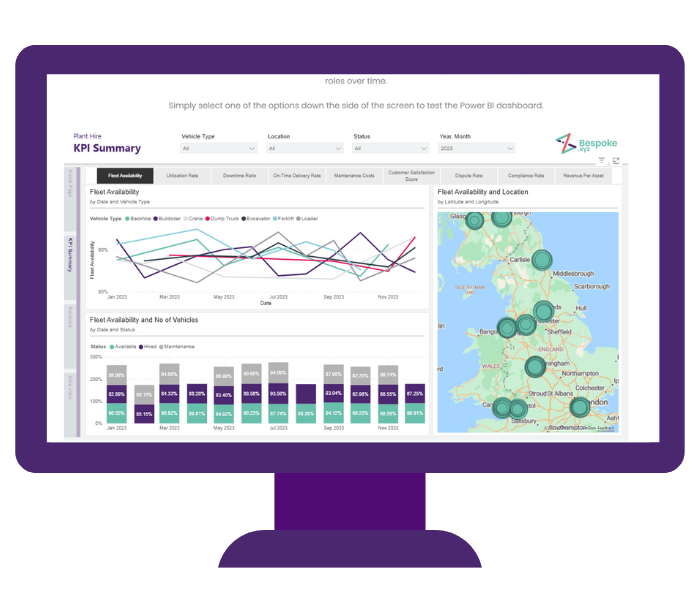
Our interactive Power BI dashboard shows how a plant hire business can turn complex datasets into clear, actionable insight.
Click through to test it with sample data, explore the filters and see for yourself how the right dashboard makes decision-making faster, easier and more accurate.
So what is the difference between a Power BI dashboard vs a report? A dashboard is a single page consisting of key information collected and combined across different reports and their datasets and facts.
A Power BI report, on the other hand, is a set of multiple pages combining different datasets that represent different findings and insights, and different pages are available to view the report data.