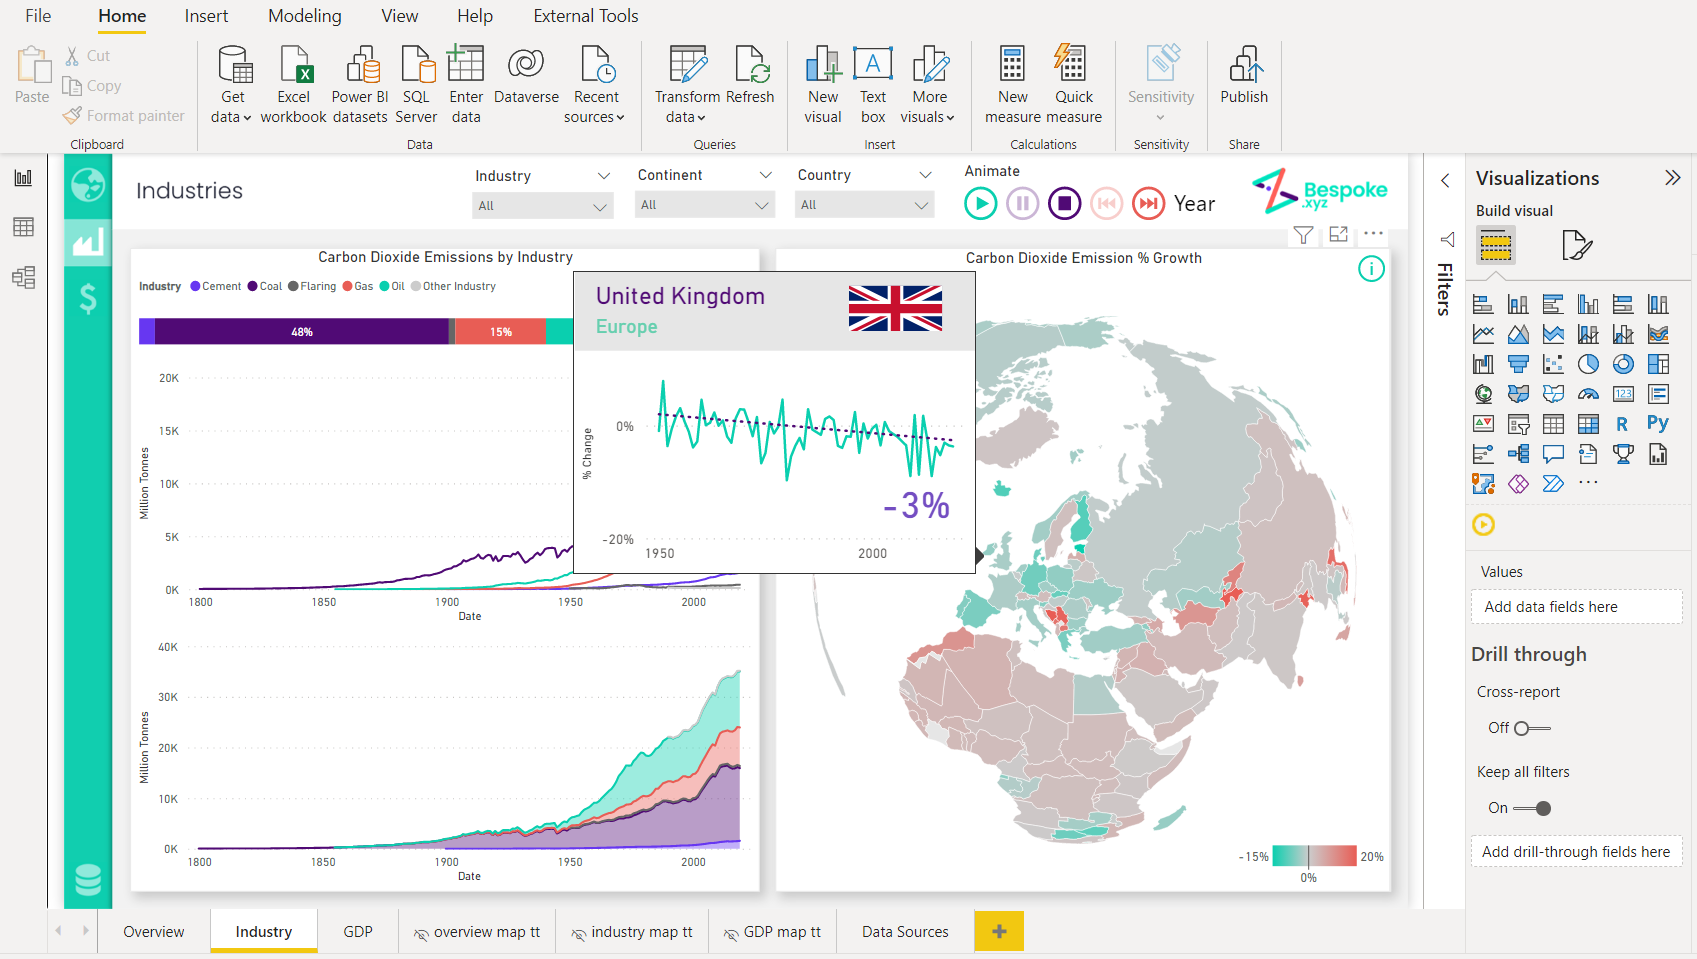
Did you know that you can replace your default tooltips with a custom tooltip containing visuals, images, and everything a full Power BI report can have?
What is a tooltip? A tooltip is a user interface element that’s displayed when a user hovers the mouse over a chart. They are useful as they provide more information without taking up space on a report. By replacing a default tooltip with a custom tooltip, you provide this information to end-users in a more digestible format by having complete control over the design.
Build the tooltip page
Creating a custom tooltip is the same process as creating any page in your report. Begin by adding a new page to your Power BI Desktop file.
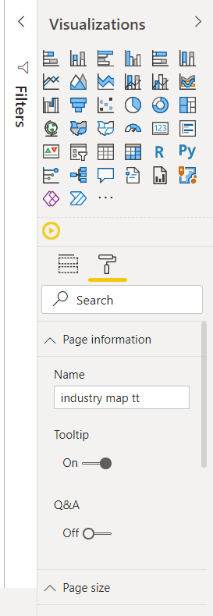
Under the Format pane, expand Page Information. Enter a suitable name for your tooltip and toggle the Tooltip option on.
Since tooltips appear when hovering over a report, it is crucial to keep them small, otherwise, there’s a danger they will cover up other visuals. Expand Page Size and select Tooltip from the dropdown. Adjust the Page View under the View tab along the ribbon to allow the page to fill the screen.
Tip: Right-click on the page tab and Hide Page as you don’t want it showing in your report when published as another report page.
You are now ready to add visuals.
Add the visuals and customise
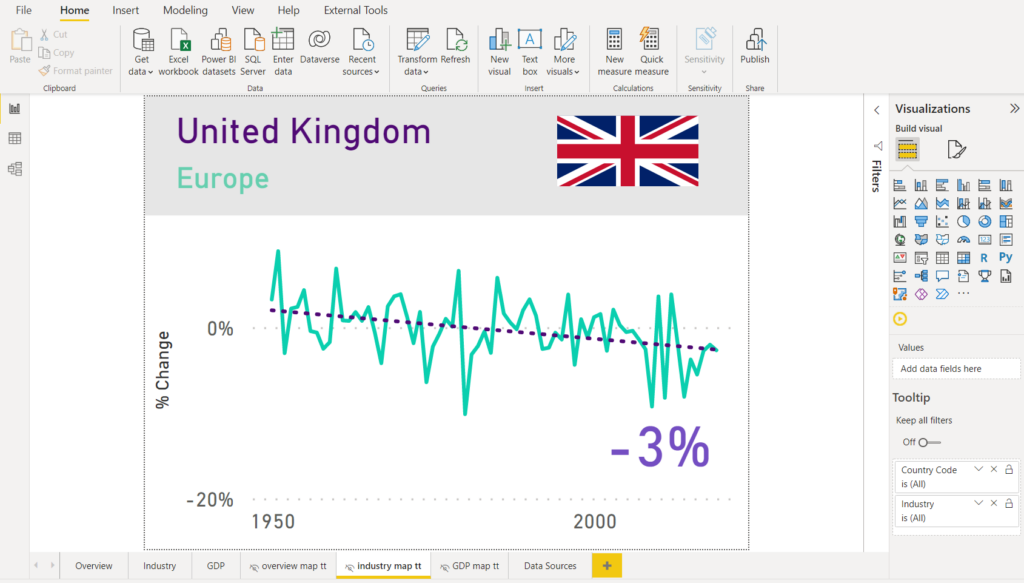
Build the tooltip out just as you would build a normal report.
Consider the small page size – adding lots of visuals to a small space will overload the end-user with information and take meaning away from the data.
Useful practices include:
- a banner/header along the top of your tooltip
- avoid adding more than one graph
- use the Card or KPI visual to highlight key values
- images can be very informative
Replacing the default tooltip
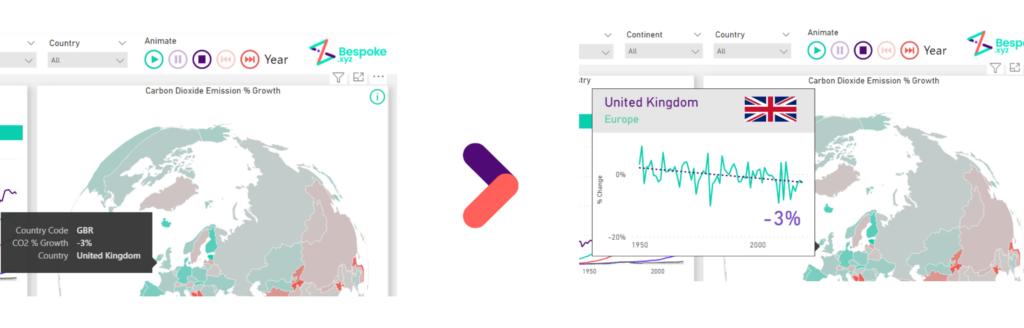
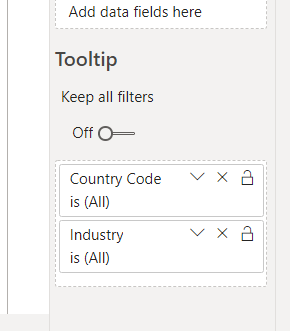
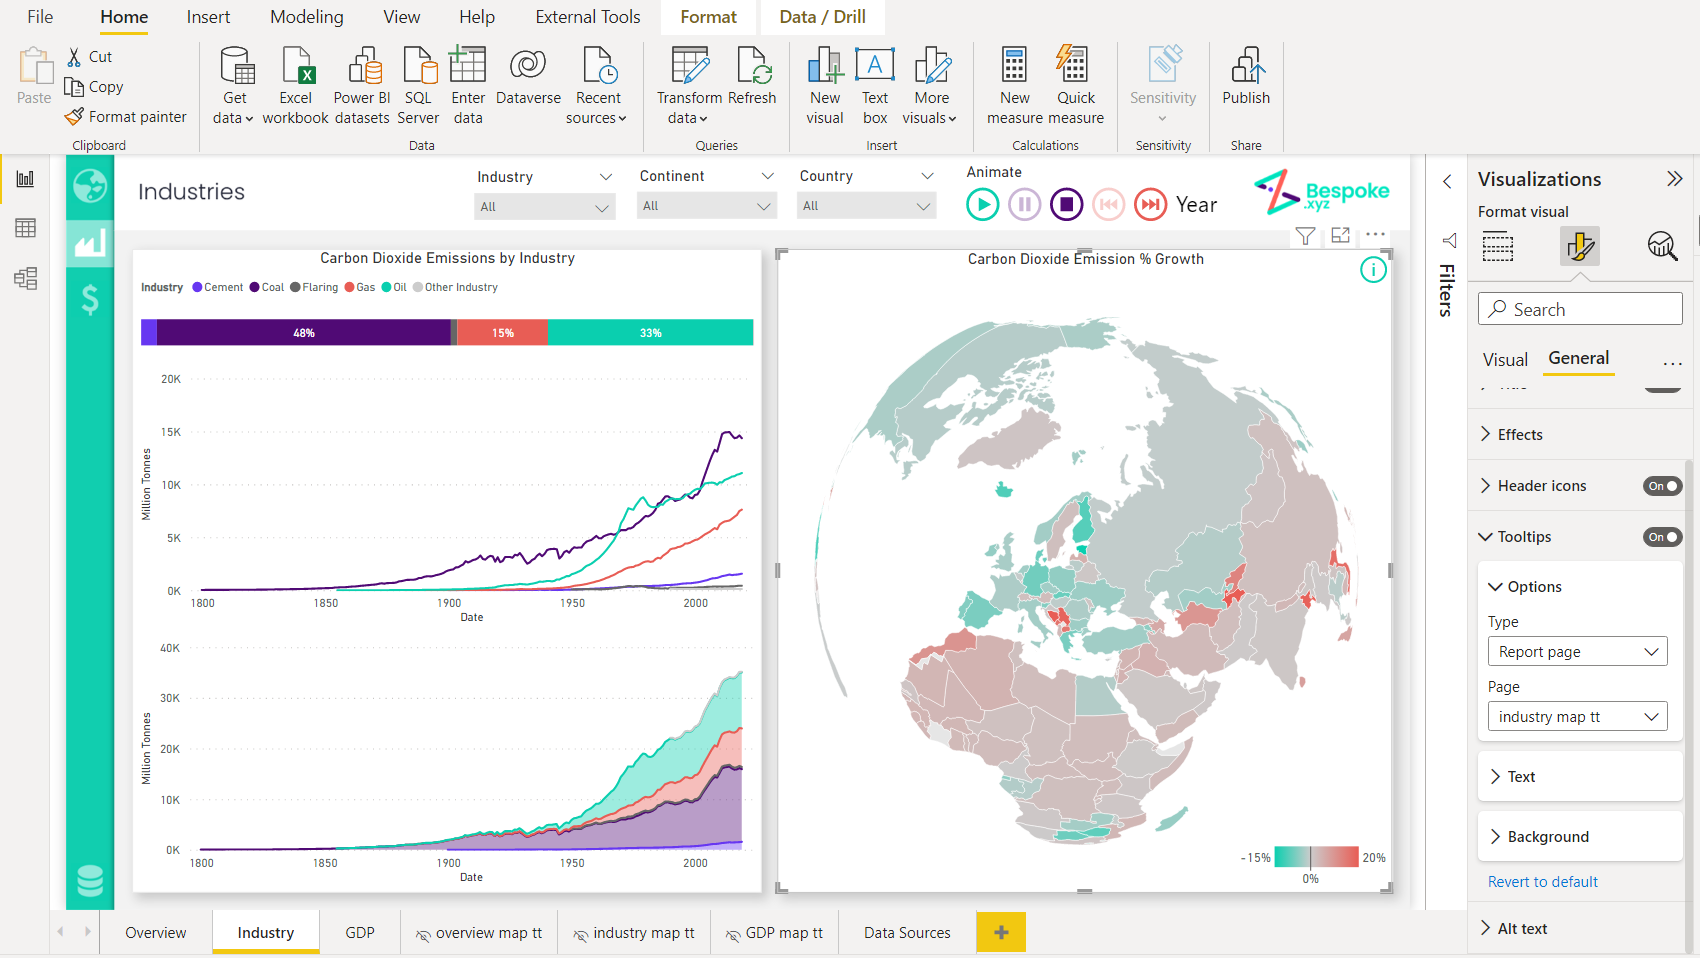
First, specify the fields and measures you wish to filter the tooltip when hovering over the report. For the above example, the goal is to filter the tooltip when hovering over a specific country on a map. Therefore, we drop the Country field in the panel labelled “Drag tooltip fields here”.
Next, select the visual you wish to add the custom tooltip too. On the Format pane, scroll down to Tooltip. Select Report Page under Type and the page you have just created under Page.
Ref: https://docs.microsoft.com/en-us/power-bi/create-reports/desktop-tooltips
To see Power BI action, speak to one of our team members today.