With data visualisation and analytics becoming ever more crucial to businesses’ success, it’s only natural that the business intelligence (BI) solution market would be growing bigger by the day.
From new players to established brands, how can organisations be sure they’re investing in the right tool for them? Here, we aim to help you feel a little more confident about this important decision, by exploring two of the market’s biggest BI platforms – Power BI and Tableau.
An intro to Power BI & Tableau
Power BI and Tableau are two giants in the business intelligence world, and as a result are heavily compared. Typically, there isn’t really a ‘right or wrong’ answer, as no tool will be able to service every type of business perfectly. But which tool is best will depend on your own business needs and existing resources, so it’s important to choose the right one for you.
What is Power BI?
Power BI is Microsoft’s own cloud-based business intelligence service; an interactive data tool that can be used to clean and transform data from a wide range of sources into meaningful insights. Users can create dashboards that track their most relevant metrics, or drill down and literally ask questions about their data. The tool also allows them to create rich reports and dashboards, and share them easily with others.
What is Tableau?
Tableau is a visual analytics platform that aims to empower both people and organisations to make the most of their data. Using its patented foundational technology, VizQL, it visually expresses data by translating drag-and-drop actions into data queries through an intuitive interface, allowing customers to see, understand and more importantly, drive change with their data.
Both Power BI and Tableau have managed to achieve that special blend of power, usability, brand status, and technical flexibility, which is why many teams find themselves comparing Microsoft Power BI and Tableau when looking for the perfect BI tool. Let’s go ahead and look at the features, functions and unique benefits of Power BI vs Tableau, to see which one performs best.
Power BI vs Tableau: Let’s Compare…
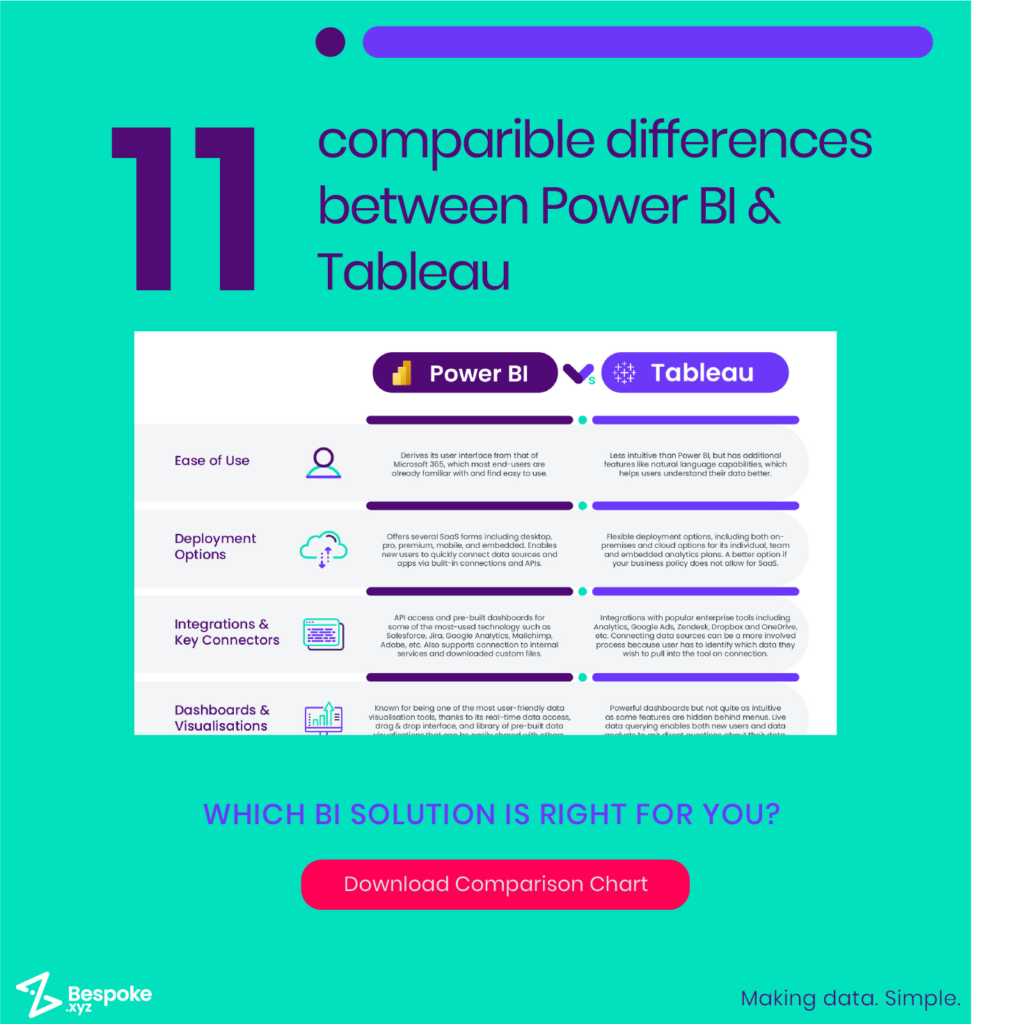
Ease of use
Any business intelligence solution needs to come equipped with powerful capabilities, yet remain simple enough for employees of different skill levels to use. One of the biggest Power BI benefits is that it is commonly praised for its ease of use thanks to its user interface derived from that of Microsoft 365, which most end-users are already familiar with.
Meanwhile, though Tableau is known for being less intuitive than Power BI, it does have some advantages for exploring and visualising data in detail (explained in more detail below). The platform is also incorporating additional features like natural language capabilities into its software, which helps users find concrete solutions to complex problems.
Deployment options
When it comes to flexible deployment options, Tableau is strong. Though Power BI comes in several SaaS forms (desktop, pro, premium, mobile, embedded etc), Tableau offers both on-premises and cloud options for its individual, team and embedded analytics plans.
The most basic setup for Power BI is an Azure tenant that can be connected to Power BI through an Office365 Admin interface, which most companies who use the software will already have in place. Power BI is easy for new users to get to grips with and enables them to quickly connect various data sources and apps via built-in connections and APIs.
Tableau allows users to connect their data sources from the opening dashboard, and begin building a worksheet where their visualisations will live. These visualisations can then be shared via Tableau Server or Tableau Online.
If for whatever reason your business policy does not allow for SaaS, then Power BI may not be compatible with your needs. Though more expensive due to its flexible deployment options, Tableau might be the better option here.
Integrations & key connections
Being able to easily connect your most-used data sources is crucial for effortless, intuitive reporting. Power BI boasts API access and pre-built dashboards for some of the most-used technology out there such as Salesforce, Jira, Google Analytics, Mailchimp, Adobe and of course Microsoft’s own products like Excel and Dynamics. Users can also connect to internal services within their organisation or download custom files to build their ideal visualisations.
Tableau has also invested heavily in integrations with popular enterprise tools, including Analytics, Google Ads, Zendesk, Dropbox and OneDrive, to name just a few. Connecting data sources can be a little bit more of an involved process compared to Power BI, because the user has to identify which data they wish to pull into the tool on connection. It’s a good idea, therefore, to decide which data you want to look at and why before connecting any data sources to Tableau.
There is, of course, the option to connect both Power BI and Tableau together. This could be useful for looking at Power BI models or datasets in Tableau, for instance. However, care needs to be taken if you have multi-factor authentication enabled or if a session remains idle for too long. It’s also important, if going down this route, that both platforms are up to date with their latest versions.
Dashboard & visualisations
Visualisations are the easiest and most effective way to organise large sets of data, ask the right questions and draw valuable insights. The dashboard will typically be where the user can access their visualisations, providing a snapshot of KPIs helping to save precious time for analysts and decision-makers.
Power BI is known for being one of the most user-friendly data visualisation tools in the business intelligence market. First and foremost it supports real-time data access, which allows teams to respond instantly to business changes fed to Power BI from the CRM, project management, sales, and financial tools. As many SaaS products and dashboard products are still striving to incorporate live data access, it’s safe to say that Power BI is a little ahead of its time here.
Secondly, Power BI’s drag-and-drop-based interface makes it easy for even novices to quickly build their own dataset, without having a whole lot of knowledge or experience. Its library of data visualisations also provides an intuitive platform with which to deliver beautiful and informative reports (check out some of our favourite Power BI dashboard examples). There’s also the integration of tiles – visualised metrics that users can pin from any report that provides an entry point into the underlying datasets, allowing key decision-makers to see the significance behind the numbers. Power BI dashboards can be easily shared with colleagues and accessed from any device through the web, which all makes for simple and effortless collaboration across teams.
Tableau dashboards are just as powerful, but perhaps a little less intuitive as many of its features are hidden behind menus. That said, Tableau manages to strike a balance between developer-dependent data querying and a more accessible drag-and-drop feature that could make it easy enough for newer users.
Its main feature, live data querying, is particularly helpful for data analysts and enables users to ask direct questions about their data. Simply select your data types for both the x and y axes, and it will build your required Tableau data visualisation. Users can also generate smooth graphics quickly through manually dragging and dropping fields, or asking for the solution in natural language using ‘Ask Data’. Tableau also has a library of pre-built templates called ‘Dashboard Starters’, which automatically create dashboards based on integrations to existing data sources. It also allows the option for users to use visualisations created by others in the Tableau online community.
Reporting features
Reporting is of course crucial for any organisation, enabling them to see what is happening within their business in any given area, at any one time. Whereas reporting was once a sluggish process saved for IT power analysts, modern BI solutions have opened a door into ‘self reporting’ for all members of an organisation, allowing them to build and share their own reports in minutes saving valuable time and IT workload.
Reports are available for all Power BI users at all subscription tiers. They are built primarily using a drag-and-drop canvas, where users can create, customise and explore their interactive and responsive reports. Once built, reports can be published to the cloud or on-premises, shared directly with other users or embedded into existing apps and websites. If a report needs to be printed, no worries – Power BI reports are designed to fit perfectly on a page. Users can even export paginated reports in various other formats such as Excel, Word, CSV, PowerPoint or PDFs.
Users of Tableau have the flexibility of both automated, scheduled reporting and ad hoc reporting as well. Reports can be created in table and spreadsheet formats, with visualisations such as graphs, charts or histograms. Like Power BI, they can also be exported in a variety of file formats like images and PDFs, which also offer a subscription function for users to receive regular updates on a specific report.
Security
Another all-important feature of any BI solution should be data security. All solutions need to be up to date with the latest protocols and certifications, and should also have features that help users easily manage who accesses various datasets and when.
Both Power BI and Tableau share largely the same security components, which include a variety of authentication methods and a diverse mix of site roles and permissions to completely control which reports and datasets are available to whom. For instance, Power BI allows users to choose whether to give read-only or reshare permissions when sharing a dashboard and can later manage individual user permissions for all their dashboards.
Tableau, meanwhile, enables users to protect live data sources by choosing whether to request database credentials when visiting a published view. It also provides admins with three different options that can be used together to manage data security, such as database login accounts, authentication modes and user filters.
While Tableau does offer row-level security, however, Power BI goes one further by offering both rows- and column-level security that can be used to restrict specific data for certain users. Power BI also leverages stronger security models thanks to Azure and its built-in cluster architecture.
Mobile capabilities
Many BI solutions are now integrating mobile capabilities to further support data analysis and data sharing on the move. This is perfect for businesses wanting to facilitate more remote working and, more importantly, provide real-time insights anywhere, anytime.
Both Power BI and Tableau each have a native mobile application that is compatible with all operating systems and enables users to securely view their dashboards and reports, all in one place. Power BI users can create and share reports, and set up push notifications for tile changes to always stay up to date. The Notifications tab will show users a personalised feed of messages about the alerts they’ve subscribed to in chronological order, including any updates to workspaces they may be a part of. Collaboration via mobile is easy thanks to features like touch-enabled annotation and sharing, geospatial analysis and QR scanning.
Tableau, meanwhile, presents mobile users with a personalised home screen where they can find a curated, tailored view of all their most important metrics. Users can interact with their dashboards and KPIs through filters, scroll and zoom actions, and drill-down functions. They can also mark, scroll, search and browse through their dashboards just as they would via desktop.
Both Power BI and Tableau’s apps provide the ability to access dashboards and reports offline as well as on. Power BI offers up to 250MB of data caching and refreshes data frequently, meaning users can access dashboards they’ve accessed before even when they’re offline (though some tiles may require an active server connection). Tableau’s app will download all of the users’ favourite workbooks and views, which can be accessed later without an internet connection. These offline features offer flexibility for users who are often on the go and need to be able to monitor certain datasets closely.
Data querying
While the database structure of your BI solution may be well and good, what about data querying? Data querying is a specific request for data written in a particular programming language (usually Structured Query Language, or SQL), which extracts and transforms key information to make it easier to understand by data analysts. This helps to uncover hidden trends and relationships in your data and enables organisations to truly maximise its full potential.
Both Power BI and Tableau support data querying, albeit in different ways. Power BI uses its Power Query Editor to connect to different sources through queries. Users can use queries to shape and understand their data and view any active data queries in a separate pane within the Power Query Editor. Simple tabs like Transform, View and Help enable them to keep everything nice and organised.
Tableau uses a query language called Visual Query Language (VizQ) to process data queries, which translates users’ drag-and-drop actions into data queries. On top of that though, it also supports SQL queries, which enables users to make a variety of custom requests. These might include connecting to a particular dataset rather than an entire dataset, or appending, combining and aggregating data. They can also create customised cross-database joins, restructure or reduce the size of data for analysis, and more. Thanks to Tableau’s AI-powered Ask Data feature, users can also make queries in natural language (see below).
Additional features & support
Extra features such as machine learning and training resources can be the tiebreaker between different BI platforms. When investing into any new software, organisations want to know that the process will be smooth sailing, so as to minimise any impact on productivity. And they also want to be sure that the solution they’re adapting makes sense for their current processes.
So how do Power BI & Tableau stack up?
Learning & support
Power BI is known for its extensive online support, consisting of guided tutorials and documentation including videos and webinars. Working with an experienced Power BI consultant can also help you to truly pinpoint your key goals early on and get maximum value from the platform.
Tableau also has support tools that are perfect for users at every stage, whether it’s running the initial set-up or beginning to truly analyse data.
Natural language processing
Power BI’s natural language query tool is possibly one of its most impressive features that enables users to feel in complete control of their data. Users can ask any number of questions of the data such as: “How much do we invest in each customer?” or “Where do our highest value customers live?”. The natural language query tool will find answers to these questions, allowing you to really hone in on those particular insights.
Tableau, meanwhile, doesn’t have a natural language query, but has integrated the Einstein AI for data discovery. Developed by Salesforce and powered by machine learning, Einstein Discovery delivers recommendations and predictive models for your data, without needing to write a single line of code. This enables anyone – from data scientists to business users – to quickly and confidently make powerful decisions guided by ethical, reliable AI.
Free trial
A free trial enables business owners to try their BI solution for a risk-free period, to see if it’s right for them. Both Power BI and Tableau offer a free trial – Power BI offers a 60-day trial for its Pro service (with Power BI Desktop being free all of the time), and Tableau offers a 14-day trial of either Tableau Server or Tableau Online (with Tableau Public being the ‘forever free’ option).
If you’re looking for a generous trial period and full access to all of the features a tool has to offer, Power BI certainly has the edge here.
Price
Price is of course another huge determining factor when choosing a BI solution. Businesses want to be sure they are getting the best bang for their buck with whatever option they go for, and also see some decent ROI. Which product will give you these things, depends entirely on your business needs and pre-existing digital infrastructure.
There’s no way around it – Power BI is the considerably more affordable option when compared to Tableau, at least when it comes to monthly and user costs. Power BI’s desktop version is free to use, and if you have a company email, Power BI service (online version) is also free as well. After that, Power BI Pro costs just £7.50 per month per user and the even more powerful Power BI Premium costs £15.10 per month per user, with options to scale up based on your specific needs. Another bonus is that Power BI users don’t have to pay directly for Office365 to gain access to the tool’s management centre interface, though there are additional charges for subscriptions and users.
Tableau’s pricing is less straightforward, particularly as the tool runs on a subscription model rather than an itemised cost. Pricing is based on a tiered system of different user types: creators, explorers and viewers – each with different permissions and accessibility options. Pricing is still very reasonable if you don’t mind spending some time exporting your data from third party tools to later upload to Tableau (though still more expensive than Power BI). If you want to directly connect Tableau to your third party apps like Google Analytics and Excel, however, this will require the Professional edition, which is where things get more costly.
If your business is already deeply invested in Microsoft software, then Power BI easily works out the cheaper option due to the way it easily integrates into the Microsoft ecosystem. If this is not the case, or your data needs are more nuanced or specific, then Tableau is worth considering – so long as you are prepared to build your own data warehouse and are aware of the greater investment over time.
Conclusion
Which BI solution is right for you depends largely on who will be using the platform and your business’ own individual needs and resources.
Power BI is undoubtedly built for the common stakeholder and users of every level – not just data analysts. This is reflected in its easy-to-use drag-and-drop interface and intuitive features that help teams create and analyse their data visualisations, without needing any prior training.
Tableau, meanwhile, is just as powerful, but its users may require a little more skill or training before they dive into the tool. This is because its interface isn’t quite as intuitive, and may be overwhelming to those just finding their feet with data science. However, those with data analysis expertise will have no trouble at all cleaning and transforming data into insightful visualisations.
Tableau is also more of a financial investment in the long-term, due to its scalable costs and high level of customisable capabilities. While its level of power, speed and flexibility do make it unique in the BI market, Power BI still wins for ease of use, as well as long-term cost.