Are your Power BI dashboards blending into the visual white noise? When every report looks like a pixelated mess of bar charts and scattered data points, how can you expect stakeholders to spot insights instantly?
Luckily, designing sleek, readable Power BI dashboards is within your grasp. With the right layouts, visuals, and data prioritisation, you can create art-worthy data that tells stories and invites exploration.
With all our combined years as a leading Power BI consultancy, our team has learned what takes dashboards from drab to fab. Whether aiming to impress the new CEO or better inform front-line decisions, compelling Power BI aesthetic is mission critical.
#1 Understand Your Audience and Decision Makers
Even visualisation wizards need to respect the end user. When architecting aesthetically pleasing dashboards, relentlessly ask – who is the audience and what decisions will this inform?
Creating a dashboard for a Sales Manager who needs to see weekly sales KPIs is going to be completely different to an Operations Manager who wants to see 15 different pipeline visuals. Providing overly complex or irrelevant data wastes time for busy users. Map what metrics matter most to viewers and cut the clutter.
Power BI’s simplicity seals its popularity. Clients regularly ask us, “How do I showcase what matters without overcomplicating?” Anchor dashboards around the audience and crucial business questions. Guide users to detailed reports for peripheral insights without packing them onto a single page.
#2 Spotlight Top Metrics
Dashboards serve a singular function – visible data synthesis for rapid review. Dump secondary facts onto printable supplementary reports. Showcase only the hottest KPIs on the dashboards themselves.
Squishing excessive tiles together encourages readers to gloss over everything indistinguishably anyhow. Remove non-vital indicators and streamline what remains into visualisation eye candy. White space and breathing room give key graphs and cards room to shine.
Getting over our ingrained tendency to stuff every insight onto a single canvas took practice at our firm. But cutting the clutter unlocks game-changing user adoption and comprehension. Decluttering means stakeholders extract intelligence effortlessly. And nothing beats deploying instantly popular dashboards.
#3 Take advantage of Tooltips
We’ve been harping on decluttering Power BI dashboards, but lean layouts needn’t starve your audience of deeper insights. Enter tooltips – the super handy visual trick letting users unveil extra dimensions without crowding your canvas.
Tooltips give you the flexibility to hover over any chart or graph, revealing supportive datasets, alternative summary metrics, or different filters in relation to the original selection.
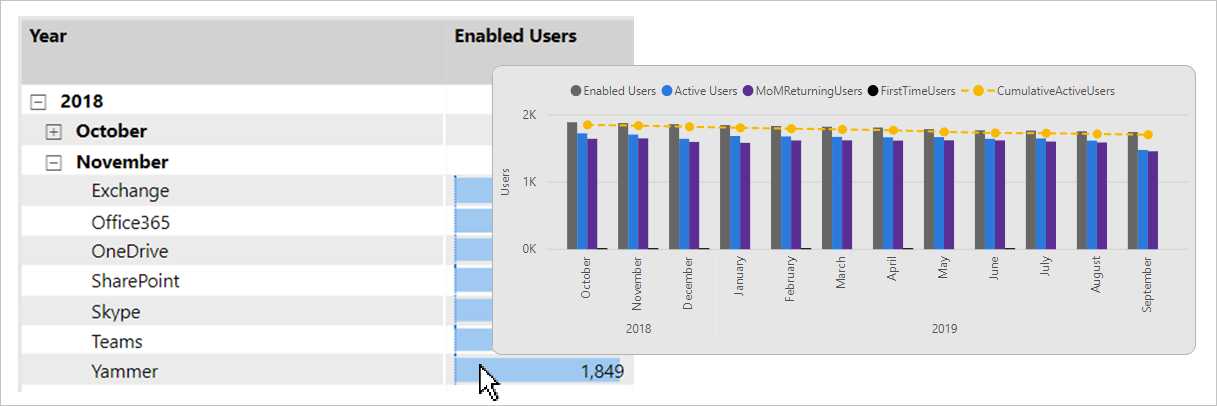
Here’s an example: as the user hovers their cursor over the EnabledUsers value, a page tooltip pops up. This tooltip shows an alternative data visualisation (a combination of line and clustered column chart) and applies a divergent time filter. Notice that the filter context for the data point is November 2018, while the page tooltip presents a trend spanning an entire year of months. This dynamic feature allows for a more comprehensive exploration of data details.
#4 Guide Users with Intentional Page Layout
Even if you’ve been raised as an Excel devotee, respect readers’ inclination towards page layouts mirroring word processing documents. Place critical insights within the top left corners of Power BI canvases, guiding eyes down and then right in Western cultures.
Leverage white space between visuals to distinctly highlight individual data stories, separating concepts with breathing room. If dashboards grow overly busy, split ideas across multiple pages with personalised page transitions.
#5 Match Visuals to Data Stories
Bar charts effectively showcase website conversion rates by demographic but fail to highlight total customer count key performance indicators (KPIs). Brainstorm visuals which allow unique insight into specific statistics.
Cards prominently display singular metrics while radial gauges demonstrate shifts versus thresholds visually. Icons represent values for rapid correlation as shapes demonstrate proportions and trends. Look beyond default options with custom visuals.
Collaborating with clients, our team map out dashboards to inspire visual innovation beyond bar charts. Creativity springs from matching data patterns, types and meanings with appropriate visualisations until each dataset’s narrative pops.
#6 Uncover Insights with Built-In AI
Instead of spending hours building reports by hand, let Power BI’s AI features do the heavy lifting.
The “Auto Insights” tool simplifies the process. For instance, you can generate charts and graphs instantly by asking natural language questions. Try typing “Show me weekly sales changes over the past year,” and watch as an interactive line graph visualisation appears in response.
#7 Build Faster with Pre-made Templates
You don’t need to reinvent the wheel every time! As Power BI consultants, we’re often asked about dashboard design acceleration techniques. If it’s a quick win you’re after – we swear by templates, meaning you can focus on the insights rather than the mechanics.
Pre-built visual bundles, colour palettes, icon sets and more assemble functional frameworks for modification. It allows you to create narratives faster by letting template creators handle foundational formulation while you overlay business data.
Have a look inside the Microsoft Community forum, there you’ll often come across posts with free dashboard templates.
#8 Annotate Trends with Conditional Formatting
Enable viewers to instantly spot outliers, thresholds, or time-based shifts via background colour coding, data bars, and icons applied through conditional formatting rules.
This not only adds a visual punch to your dashboard but also enhances the storytelling aspect of your data. Leverage these formats to direct attention towards sales spikes, pipeline drop-offs, abandoned shopping cart upticks, and more without the need for manual annotations.
Highlight positivity in green hues and concerning deviations in eye-catching red, creating a compelling narrative that engages users and ensures a deeper understanding of the data.
#9 Combine Power BI and Power Apps
Power BI is pretty powerful on its own. But when teamed up with Power Apps, it’s a force to be reckoned with.
You can use your Power BI reports in your Power Apps solutions, place Power Apps directly in your BI reports, and even create Power Automate workflows within Power BI.
When you want to act on data insights – like adding a customer to an email campaign or making a budget request – you can integrate the app or workflow right into your report. The filters and selections you make in Power BI transfer straight over to the app or workflow.
#10 Never Stop Experimenting with Your Power BI Dashboards
Even dashboard masters continually polish their skills. With Power BI’s flexible features, you can experiment endlessly with minimal risk. Play around with updated colours, icons, text density, and negative space balance for an optimised look and feel.
The key is incremental optimisation—small tweaks can lead to significant improvements over time.
For fresh ideas, explore what other developers are creating. We have some fun live Power BI dashboard examples you can check out for some inspiration. Keep that creativity flowing!
Getting Started – Do you Need a Power BI Consultant?
Power BI makes self-service business analytics attainable for everyone, though advanced data visualisation has a learning curve.
While there are ample learning resources, a Microsoft BI consultant’s experience can help you determine if your use case warrants:
- An outsider assessment on where Power BI can best support untapped potential in your data
- Strategic direction aligning capabilities with business goals
- Customised dashboards, efficient data integration flows, and impactful visuals designed by an expert
If any of the above resonates, an outside specialist could accelerate your path to adoption and ROI. If opting for internal learning instead, community forums provide support.
The key is matching your approach to objectives and needs. With the right strategy, even complex data can reveal clear and actionable insights. Does your organisation require targeted guidance upfront to build foundations for self-service success? Let’s connect to explore the possibilities tailored to your environment and use cases.