Get a callback from our team within 20 minutes during business hours.
Please fill out the form below, and someone from our team will give you a call back within 20 minutes (9-5 pm Monday to Friday). Outside of these hours, we will get back to you as soon as possible.
"*" indicates required fields
We’re not just Excel specialists, we’re business efficiency fanatics. We’ve spent years transforming spreadsheets into success stories and crafting innovative Excel solutions. But what if we told you Excel isn’t necessarily the future of data management?
Home » Technologies » Excel

Even as seasoned Excel experts, we’re well aware of the limitations that can come with it. Excel, powerful and versatile as it is, can sometimes pose challenges.

Excel can become unwieldy when handling large-scale data. It may slow down or even crash when processing large datasets, making it less ideal for big data management.

Excel is not built for real-time collaboration. Multiple users working on the same spreadsheet can lead to version control issues and errors.

Excel files are prone to security risks, as they can be easily shared, lost, or accessed by unauthorised individuals.

Excel requires a lot of manual data entry, which can be time-consuming and prone to errors.

While Excel does offer charting capabilities, it falls short when it comes to complex data visualisation and reporting.

Excel has limited automation capabilities. Tasks like data collection, data cleaning, and report generation require manual intervention.

Before diving headfirst into the world of Excel alternatives, it’s important to understand your current data management needs and how well Excel is serving them.
Remember, the ultimate goal is to make your data work harder for you, not the other way around. If you’re looking for an Excel specialist who can help you explore the right Excel alternatives, then you’re in the right place.

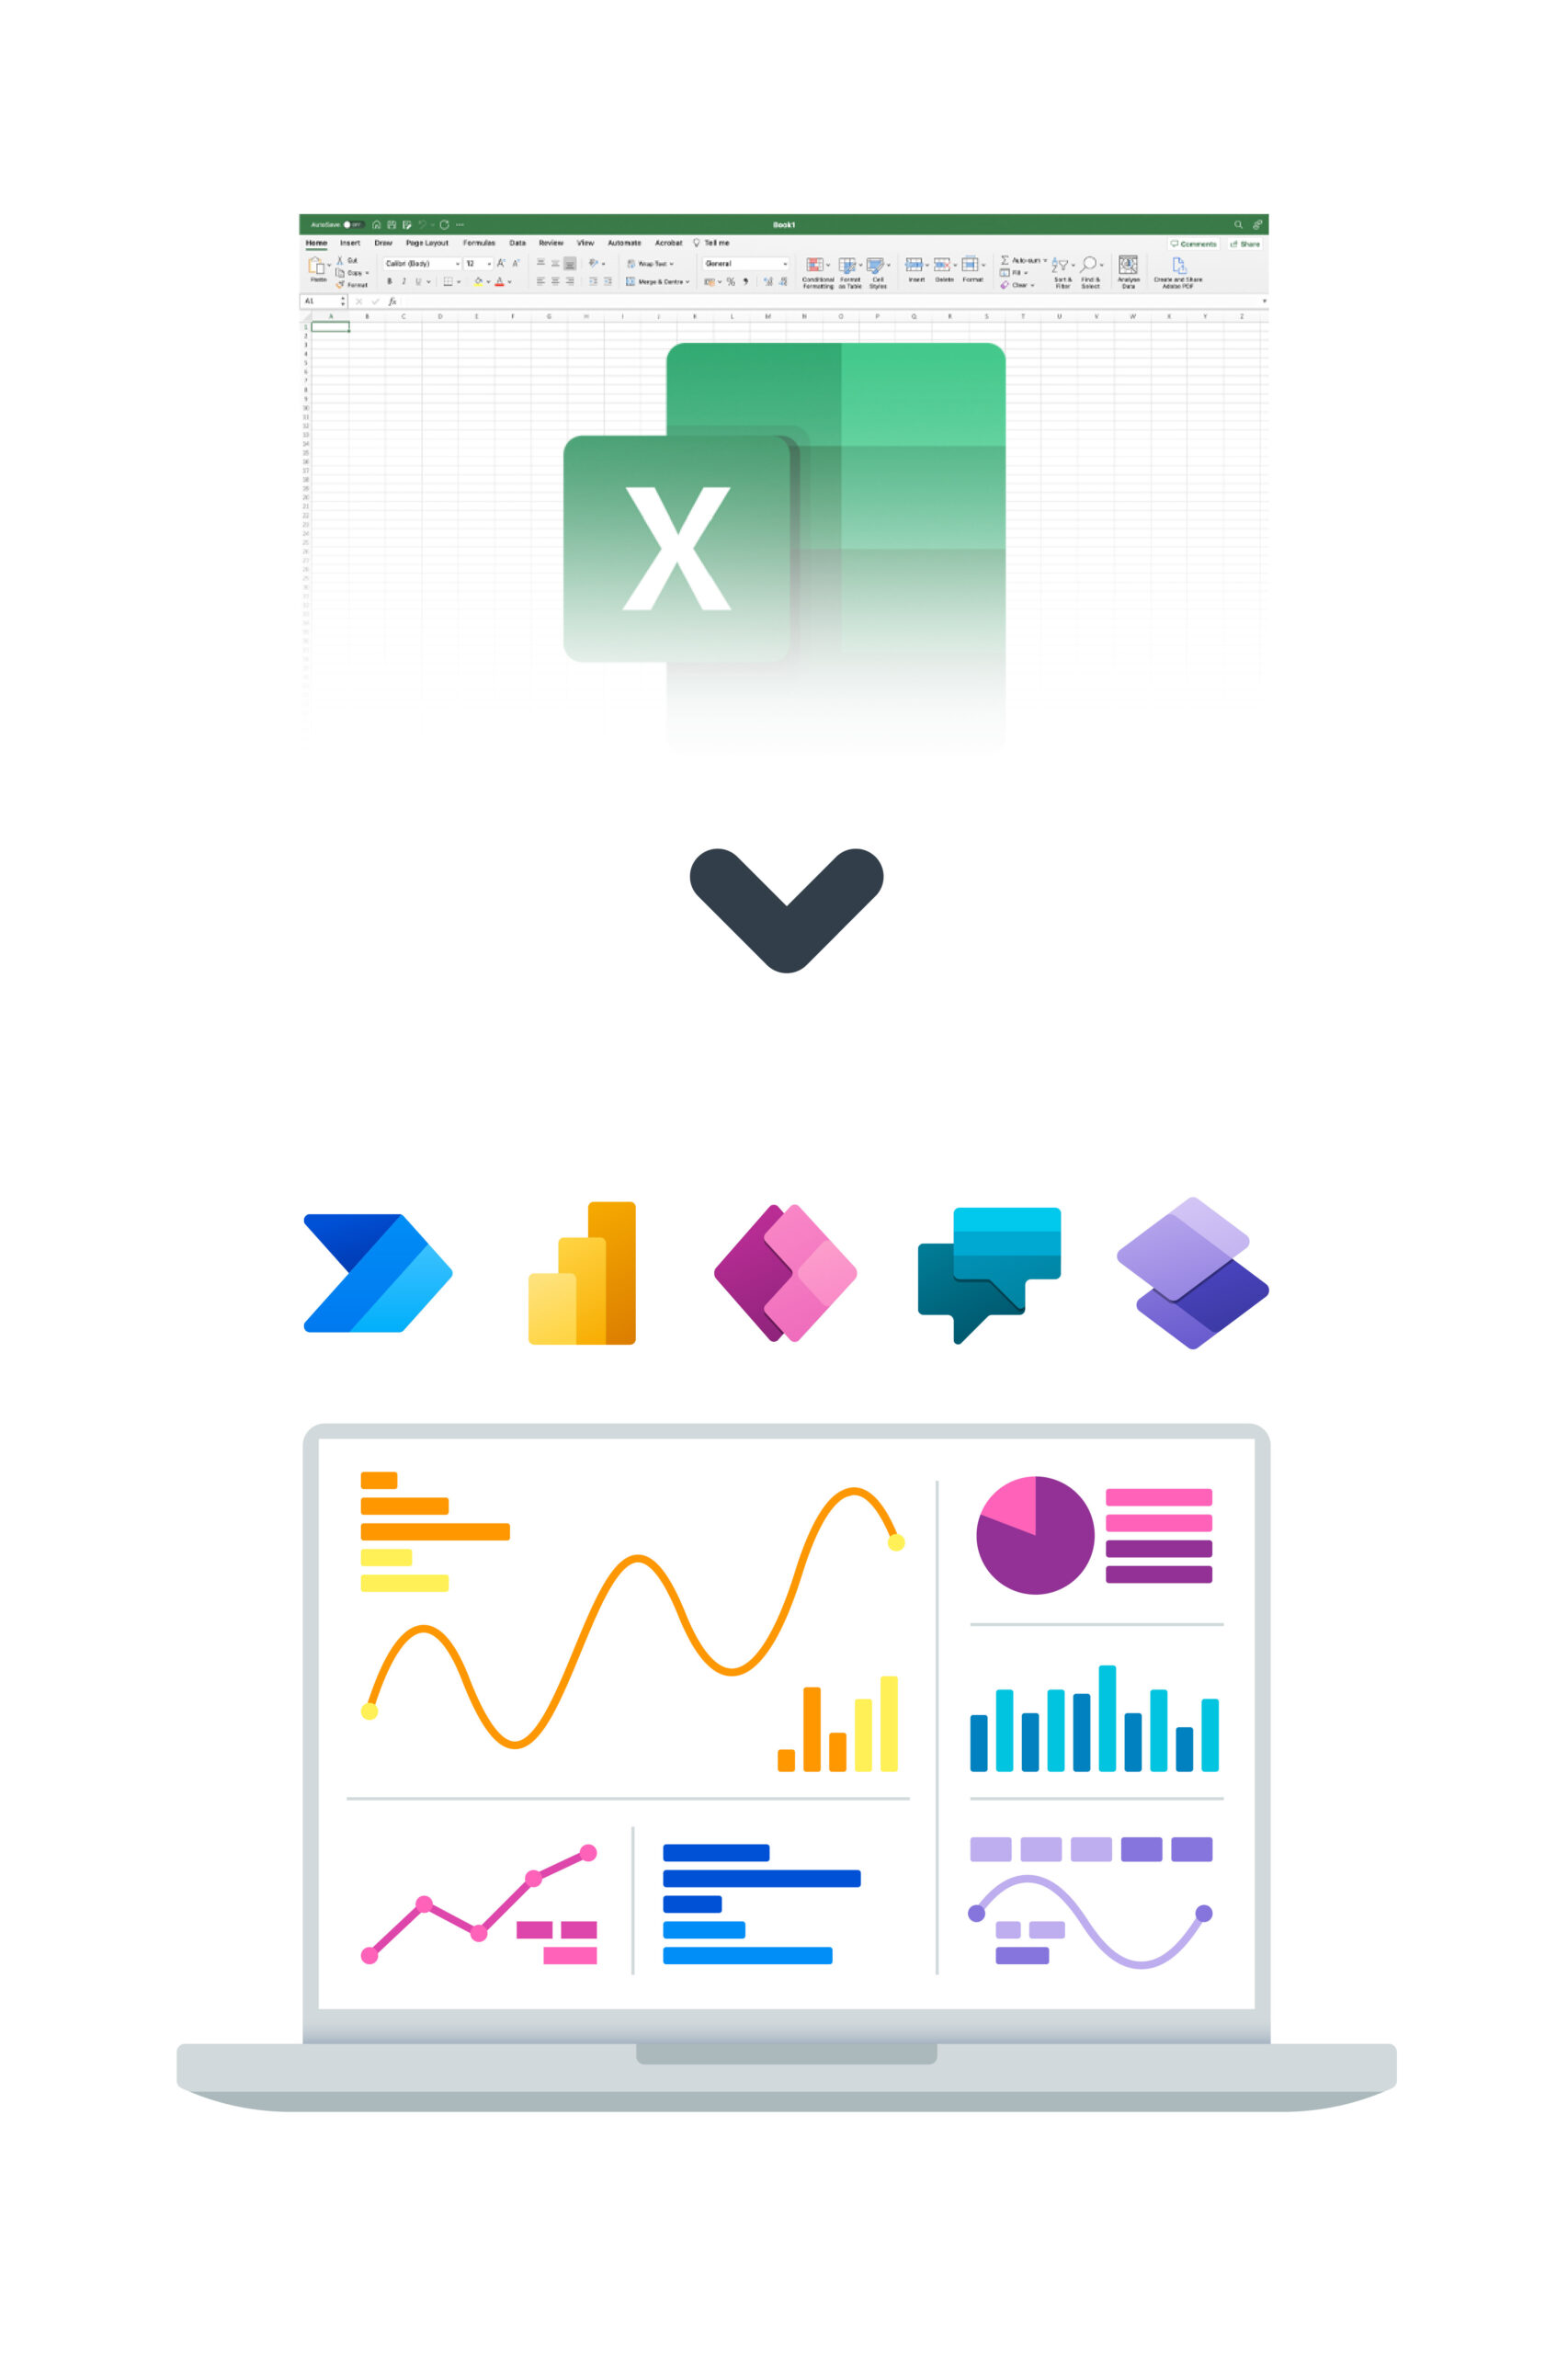
Wave goodbye to the limitations of large datasets. The Power Platform can handle and analyse massive amounts of data with ease, ensuring smooth and efficient performance at all times.
Wave goodbye to the limitations of large datasets. The Power Platform can handle and analyse massive amounts of data with ease, ensuring smooth and efficient performance at all times.
Forget about complex formulas. Power BI’s simple drag-and-drop interfaces and natural language queries make advanced data analysis accessible, while real-time collaboration, seamless sharing, and easy version control foster teamwork.
Rest assured, your data is safe with the Power Platform. It comes equipped with advanced security features and compliance standards, ensuring your business data stays protected.
With Power Automate, you can automate repetitive tasks and workflows, saving you precious time. Plus, the Power Platform integrates seamlessly with other Microsoft products and various third-party apps.

Uncover how the Power Platform can enhance your business operations and boost efficiency. Explore its potential below.

Take a closer look at the vast selection of Excel alternatives and Microsoft technologies that Bespoke specialises in, delivering customised solutions for your specific business needs.

At Bespoke XYZ, we’re not just Excel Experts; we’re your partners in the journey towards digital transformation. Our expertise goes beyond Excel solutions, diving deep into the world of powerful Excel alternatives like Microsoft’s Power Platform. Our team doesn’t just implement new tools; we tailor them to fit your business needs perfectly.
We start by understanding your unique business requirements, challenges & objectives. Enabling us to suggest the best Excel alternatives.
We ensure a smooth transition from Excel to Power Platform, minimising operational disruption & handling data migration and tool setup.
We reject a one-size-fits-all approach, instead crafting Power Platform solutions tailored to your specific business needs.
Switching tools can be daunting, so we provide thorough training and continuous support, guaranteeing your team’s comfort and proficiency with the Power Platform.